Address

2301 Av. D'Estimauville,
Québec, Qc G1E 1T2

Email

laboratoireparole@crulrg.ulaval.ca

Call Us

418-821-1229

Brain stimulation: same protocol, different effects

Facebook
X
LinkedIn

Why do two people who receive the exact same brain stimulation sometimes react in completely opposite ways? That’s one of the central questions behind a project we’ve been running in the lab for four years — and we just submitted the results for publication!

🎉🌞💃🏼

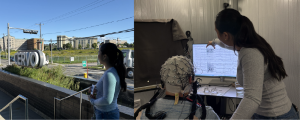
There are several ways to stimulate activity in the human brain. The one we use in the lab is called “transcranial magnetic stimulation,” or TMS: a technique that painlessly stimulates the brain by rapidly pulsing a magnetic field from a coil of insulated copper wire, encased in plastic, and placed on the head (Figure 1). A current flowing through the coil produces this very weak magnetic field, which in turn induces a secondary current in a tiny region of the brain. TMS temporarily modulate (increasing or decreasing) the activity of a small area of the brain (a few square millimeters) for anywhere from a few seconds to a few minutes. Because it modulates brain activity, the technique is sometimes called neuromodulation.

Figure 1. Transcranial magnetic stimulation setup combined with electroencephalography (TMS-EEG). (A) TMS coil positioned above the scalp to stimulate a targeted brain region. (B) A participant wearing an EEG cap.

In this project, we use a particular TMS protocol called intermittent theta-burst stimulation (iTBS) (Figure 2). Its big advantage: a full session takes only a few minutes. iTBS is also generally thought to increase the excitability of the stimulated region, in other words, to make it more responsive afterward. But as you’ll see in the results, reality turned out to be more nuanced! (See Box 1 for the technical details.)

Box — What is iTBS?

iTBS (intermittent theta-burst stimulation) is a specific form of repetitive magnetic stimulation. Rather than delivering pulses at a regular pace, it groups them into very short bursts of three closely spaced pulses, repeated five times per second (a rhythm known as “theta,” hence the name). These bursts are themselves delivered intermittently: two-second trains of stimulation are followed by eight-second pauses, and so on for just over three minutes (see Figure 2). The cycle is repeated 20 times, for a total of 600 pulses.

Figure 2. “Intermittent theta-burst” stimulation (iTBS). 600 pulses are delivered over 20 cycles of 10 pulse triplets each, across three minutes. Each cycle lasts 10 seconds, for a total duration of 200 seconds (3 minutes 20 seconds). Used with permission from Valérie Brisson, 2024 (doctoral thesis).

We recently used this method in two studies, led by Valérie and Pascale, aimed at improving speech perception in noise. The results are promising — an improvement was observed — but modest. Which is why we want to better understand iTBS’s effects and the factors driving the wide variability in how people respond to it. It’s well known that some people respond to stimulation with clear benefits, while others don’t respond at all — not unlike how many medications work for some people but not others. Age could be one factor: if the brain’s capacity to respond to stimulation declined with age, that would limit the usefulness of TMS in older adults — precisely the people who might benefit from it most, since communication disorders become more common later in life. Sex and the state of brain activity before stimulation could also play a role.

The brain’s electrical activity oscillates at different speeds, grouped into frequency bands — ranging from the slowest (delta, theta) to the fastest (alpha, beta, gamma). Each band is associated with different brain states and functions. For example, gamma waves, the fastest of all, are linked to periods of active information processing. So, someone with more brain activity in a given frequency band might be more or less responsive to stimulation. On top of that, how long stimulation effects last, and the extent of the impacts, still need to be clarified. These effects have been measured in several studies, but not in the regions we’re interested in at the lab: the regions that control speech and language.

Led by Pascale, the lab’s director, this four-year project also gave us the chance to train a number of students: Juan, Camille, Marianne, Thomas, Keir, Marie, Marc-Antoine, Marion, and Jessica.

Over the course of the project, we recruited 25 healthy participants between the ages of 20 and 85, none of whom had medical condition incompatible with MRI or TMS (such as metal implants or a history of epilepsy). The study involved four visits: the first at the CERVO MRI imaging centre to take brain scans of each participant, and the other three in our lab’s sound-attenuated testing room. At each lab session, a different region was stimulated with TMS, allowing us to compare stimulation effects across different language-related brain areas. In total, that’s roughly 100 data collection sessions, close to 10 hours per participant!

In this project, we targeted two regions involved in speech processing — one in the frontal lobe and one in the temporal lobe — along with a third site, the vertex (at the very top of the head), which served as a site for comparison (control). These regions were identified from each participant’s own MRI scans, obtained on our new imaging platform at CERVO (see Figure 3). This allows us to account for each person’s individual brain anatomy; every brain is so different! MRI is an imaging technique that produces high-quality images of the body and brain. Those brain images are generated using a magnetic field and radiofrequency waves generated by the MRI scanner.
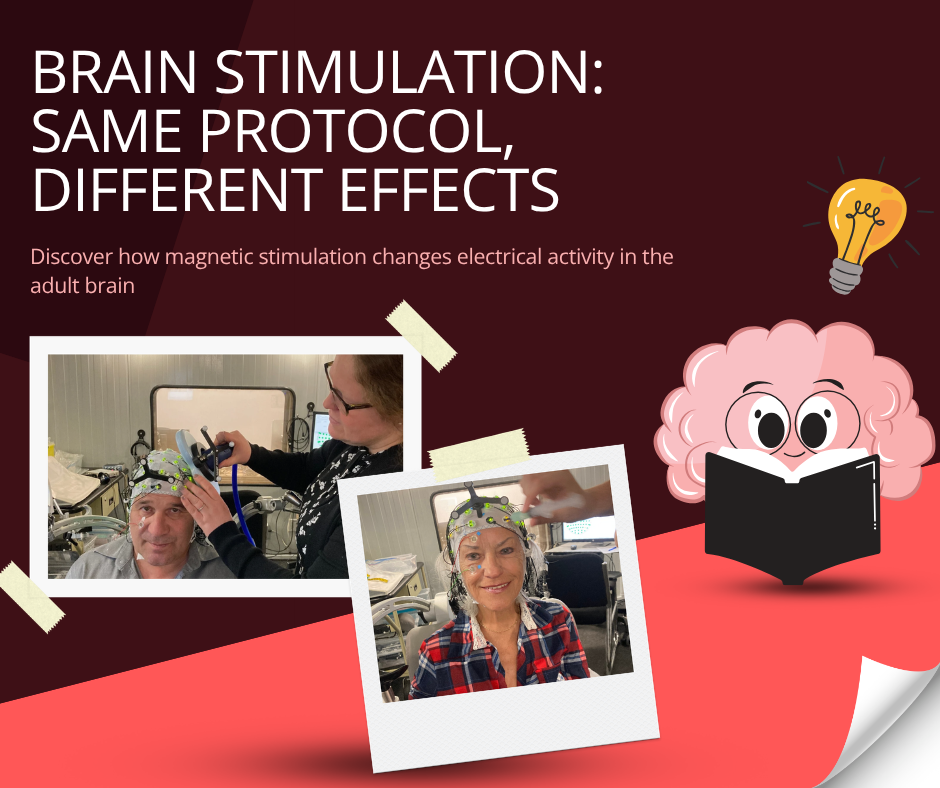
Figure 3. Stimulation sites. For each participant, the exact position of the target regions was determined from their own MRI scans (since every brain is different). Three sites were targeted: (A) the PMv, a region involved in speech production and perception (pink dot); (B) the STG, a region of the auditory cortex involved in speech perception (turquoise dot); (C) the vertex, a control site at the top of the head not involved in speech (yellow dot).

Throughout the project, brain activity was measured using electroencephalography (EEG) before and after stimulation. EEG is a safe, non-invasive technique that records the electrical activity generated by neurons through small electrodes placed on the head (Figure 1B and C). Brain electrical activity was recorded before stimulation and for 60 minutes afterward, to determine when it would return to baseline. That 60-minute window was broken down into several short intervals. During recordings, participants remained still and at rest. This design let us study the brain’s baseline (or resting) activity, which is considered a marker of brain health.

What our data taught us

Data collection wrapped up in 2025 and Pascale spent close to a year analyzing the EEG data together with her colleague Philippe Albouy, a professor at Université Laval’s School of Psychology. Here’s what we found.

Overall, older brains respond to stimulation much the same way younger ones do — which is excellent news, since one might have expected responsiveness to decline with age. Age still played a subtle role in certain regions, notably the auditory cortex, where responses varied somewhat with age. Sex didn’t change the overall size of the responses, but men and women showed slightly different patterns: in men, stimulation more often led to a decrease in activity.

As expected, the results were highly variable. So variable, in fact, that Pascale had to develop a new analysis strategy just to categorize the types of responses observed (which explains much of the gap between the end of data collection and the publication of the results). Three response profiles emerged: in some people, neurostimulation produced a temporary increase in resting brain activity; in others, the same neurostimulation produced a decrease; and in still others, activity fluctuated around its starting level with no clear direction — a profile we labelled “mixed.” Figure 4 shows clearly why this new approach was necessary. Averaging all responses together (panel A) produces a nearly flat curve, which might suggest stimulation has no effect at all. Only once the responses are split by direction (panel B) that the three profiles emerge, revealing that the “flat” average was actually the result of opposite responses cancelling each other out.

Figure 4. Three response profiles to stimulation. The vertical axis shows the change in brain activity relative to baseline (up = increase, down = decrease); the horizontal axis tracks time elapsed after stimulation (about one hour, left to right). (A) When averaged across all participants, the curve stays nearly flat, close to zero, suggesting stimulation has almost no effect. (B) But once responses are sorted by direction, three distinct profiles appear: some people show an increase in activity (facilitation, in green), others a decrease (suppression, in red), and others a response that fluctuates around baseline with no clear direction (mixed, in purple). Shaded areas indicate the margin of uncertainty (95% confidence interval).

Importantly, very few people fall neatly into a single profile. Most show a mix of responses that varies from one region, frequency band, or session to the next: on average, a person’s dominant profile appeared only about six times out of ten. So the response to stimulation looks less like a fixed trait of the individual than a fluid, fluctuating state. Figure 5 illustrates this variability.

Figure 5. The response to stimulation is variable. Each row represents one participant, and each small square represents a single measurement (colour-coded by response type: red = decrease, green = increase, purple = mixed response). In most people, the three colours are mixed together, showing that the response to stimulation isn't fixed but fluctuates from one measurement to the next. A few people are the exception, with a very consistent response (rows that are almost solid in colour).

Among the frequency bands mentioned earlier, gamma — the fastest, associated with active information processing — turned out to be the most sensitive to stimulation, showing the strongest modulations.

The aperiodic component of the signal, by contrast, remained unchanged after stimulation. The EEG signal is actually made up of two overlapping elements: rhythmic oscillations (the frequency bands discussed above) and a constant, non-rhythmic “background noise,” known as the aperiodic component. This background noise reflects the overall balance between neuronal activation and inhibition in the brain — two forces in perpetual equilibrium. Our results show that stimulation doesn’t touch this backdrop: it modulates brain rhythms while leaving this underlying balance intact. Age, however, does affect this component: our data show it decreases slightly as people get older, suggesting a subtle shift in the balance between activation and inhibition.

This study contributes several new insights into the effects of iTBS:

  • The effect of iTBS is detectable for close to 60 minutes.
  • The direction of that effect varies enormously from person to person, and can either increase or decrease brain activity.
  • Its effect, however, varies little with age or sex.

The paper, co-authored by Pascale and Philippe, was submitted this week to a scientific journal for peer review. A second paper may follow, covering further analyses of this rich dataset. This study will be followed by others examining the impact of additional factors on the effects of iTBS, with the goal of optimizing studies and treatments that rely on this technique.