Electroencephalography is a technique that measures the electrical activity generated by large populations of neurons through electrodes placed on the scalp.

This electrical activity is transcribed as a trace called an electroencephalogram (see Figure 1), which illustrates the variations in the electrical activity of the brain over time. EEG is not only used to study brain function in healthy people, but also to diagnose certain diseases that alter brain electrical activity (e.g., epilepsy, migraines, sleep disorders).

Figure 1. Example of an EEG diagram, where each horizontal line represents the activity measured by one electrode.

History

The first EEG recordings date back to the late 19th century. In 1875, British physician Richard Caton was the first to suggest, based on his work with animals, that the electrical activity generated by the brain reflects mental activity. His studies showed that patterns of electrical activity vary not only according to the state of consciousness of the animal (e.g., awakening, sleep, anesthesia, death), but also according to external stimulations (Collura, 1993). 

It was only forty-nine years later that the first EEG recording was made with humans. In 1924, the German neuropsychiatrist Hans Berger recorded the brain electrical activity of a young patient who underwent trepanation to remove a cervical tumor. Berger was the first to describe the relationship between mental activity and variations in the electrical signal in certain frequency bands in humans. In 1929, Berger published the results of his observations. In this publication, he describes two brain rhythms: alpha and beta (both described below in the section on brain rhythms). Berger’s work marked the beginning of the use of EEG in the clinical and research fields.

The source of the EEG signal

Most of the EEG-recorded electrical activity comes from pyramidal neurons located in layers III, V and VI of the cortex (see Figure 2). The signal originates from the synchronization of about 100,000 neurons. In fact, it is not possible to record the electrical activity of individual cells of the human brain. This type of research is only possible in animals.

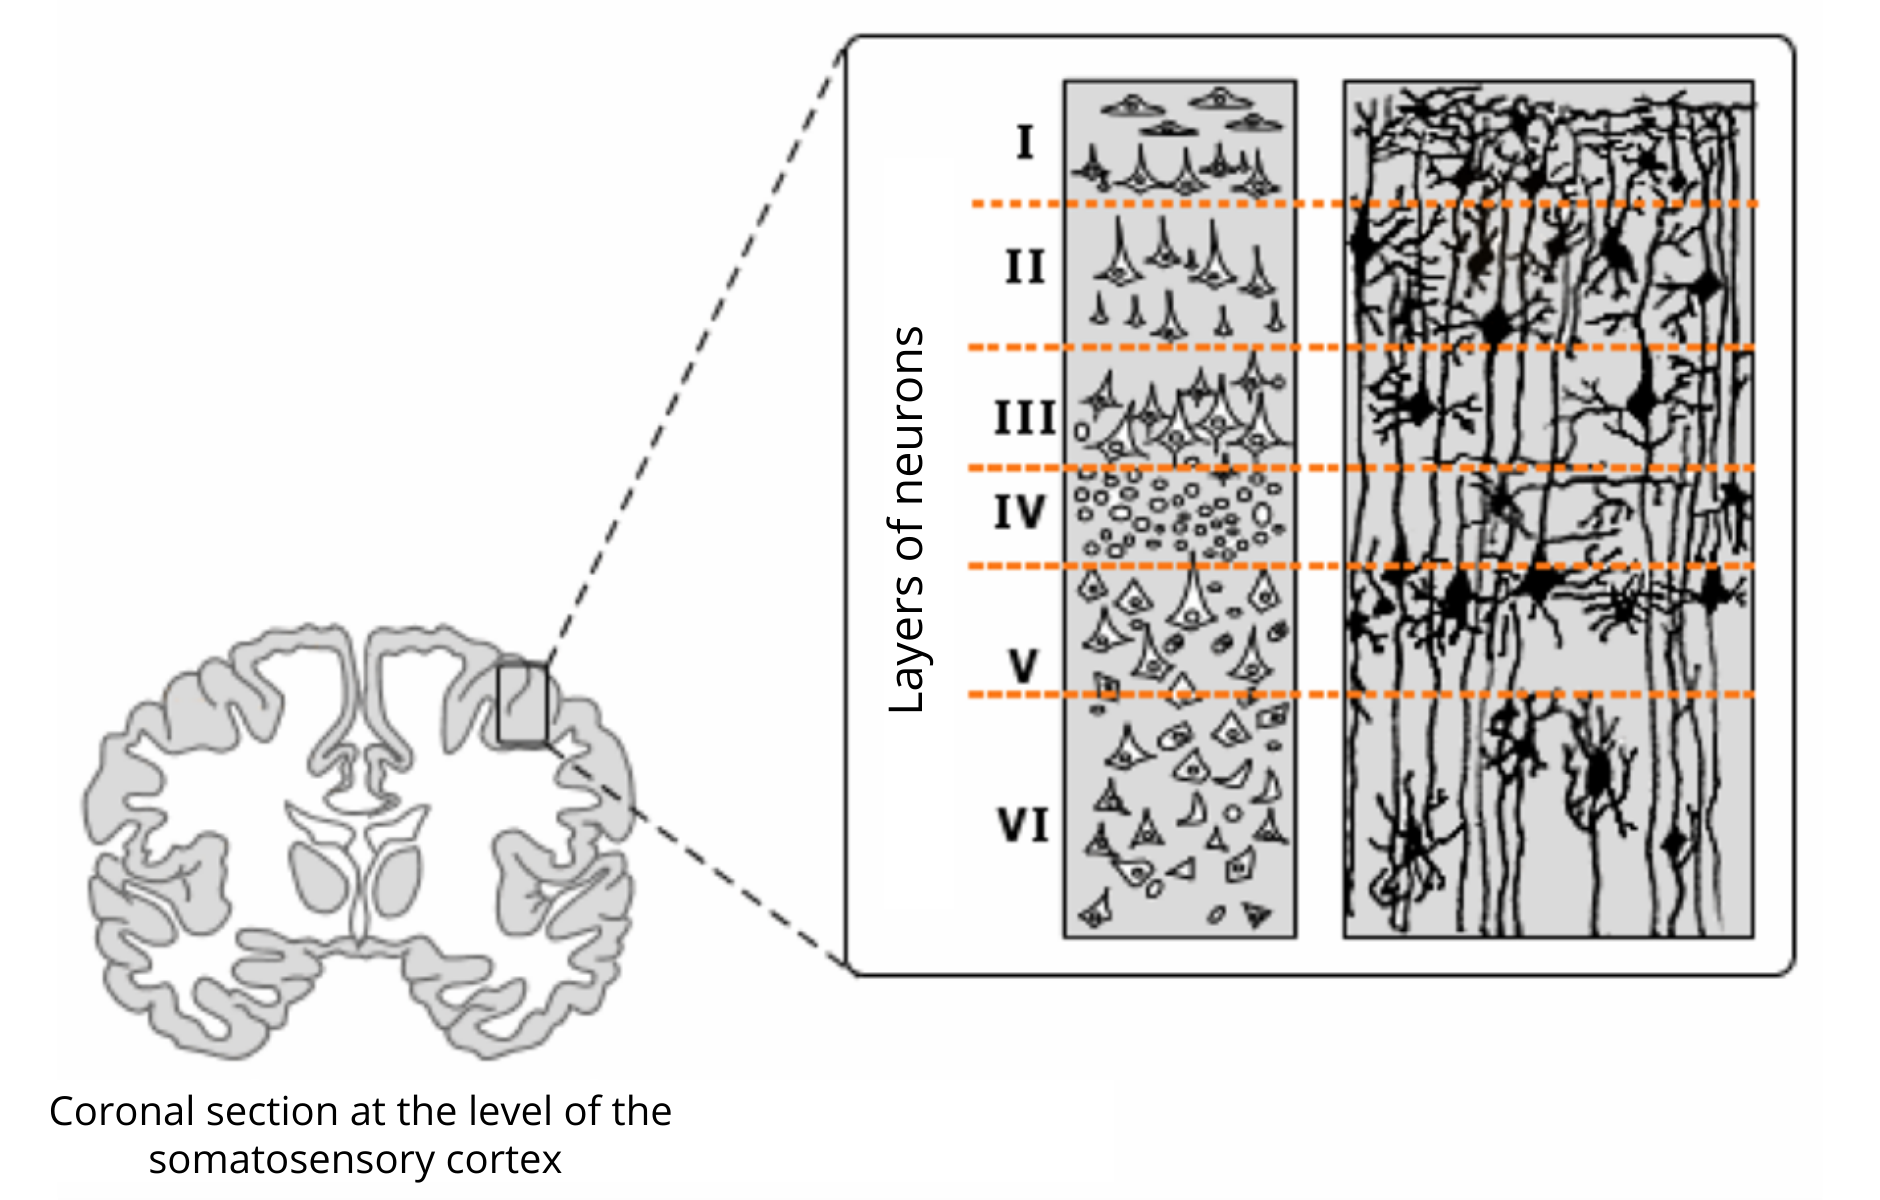
Figure 2. The six layers of the human cortex (adapted from http://www.maxicours.com/se/fiche/0/2/142702.html).

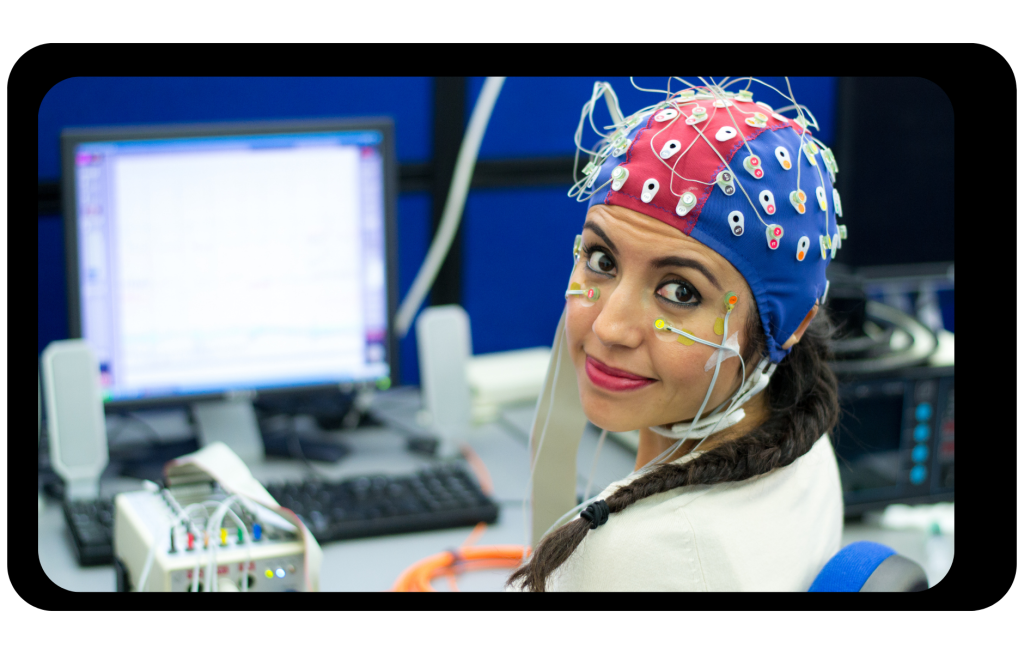
The electrical potentials generated by neurons are captured by small sensors, called electrodes, which are usually silver chloride electrodes (AgCl). The electrodes can be attached to the scalp by means of paste or with a conductive gel and a cap. EEG helmets often have 32 or 64 electrodes, but some can have up to 256!  EEG systems thus allow a continuous recording of a huge number of signals. Since the EEG signals are of low amplitude (i.e. at the microvolt-range [μV]; typically between 0.5 and 100 μV), they must be amplified thousands of times (10,000 to 50,000) using an amplification device (Teplan, 2002). Paste or gel reduces impedance (i.e. resistance to current passage), measured in ohms, which facilitates recordings.

In addition to measuring the electrical activity of neurons, EEG also captures the electrical activity generated by body movements, eye blinks, and surrounding devices such as computers and cellphones! Therefore, people undertaking an EEG exam are usually asked to keep their face as relaxed as possible, and to minimize eye blinks and body movements. Furthermore, laboratory experiments often take place inside a Faraday cage, a special room which blocks of electromagnetic noise generated by electronic devices located outside of the room. Minimizing movements and using faraday cages limit the amount noise in the EEG signal and facilitate its analysis.

Types of EEG signals

EEG can be used to measure the spontaneous electrical activity of the resting brain, for example when an awake person does not do a specific activity, which makes it possible to quantify different brain rhythms. It is also possible to use EEG to measure electrical activity associated with speech and language processes (e.g., Tremblay et al., 2021Pinto et al., 2019Tremblay et al., 2008) or cognitive processes such as memory, for example, which allows measuring evoked potentials. Brain rhythms and evoked potentials are defined in the following sections.

Brain rythms

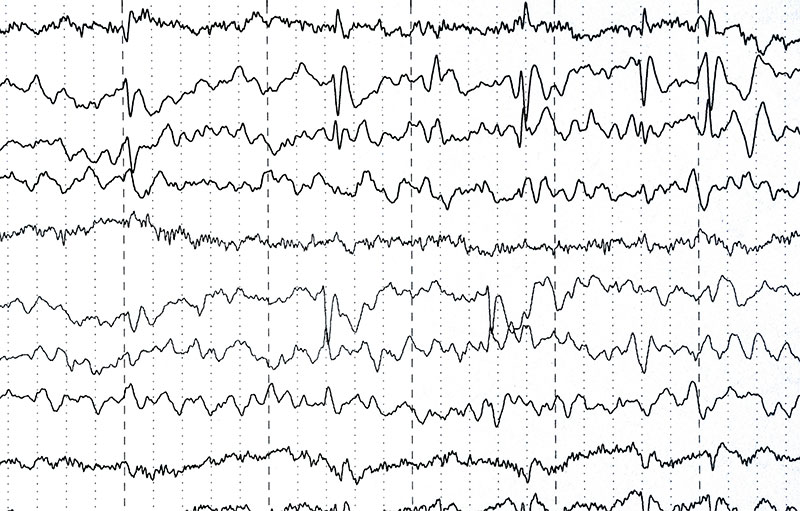
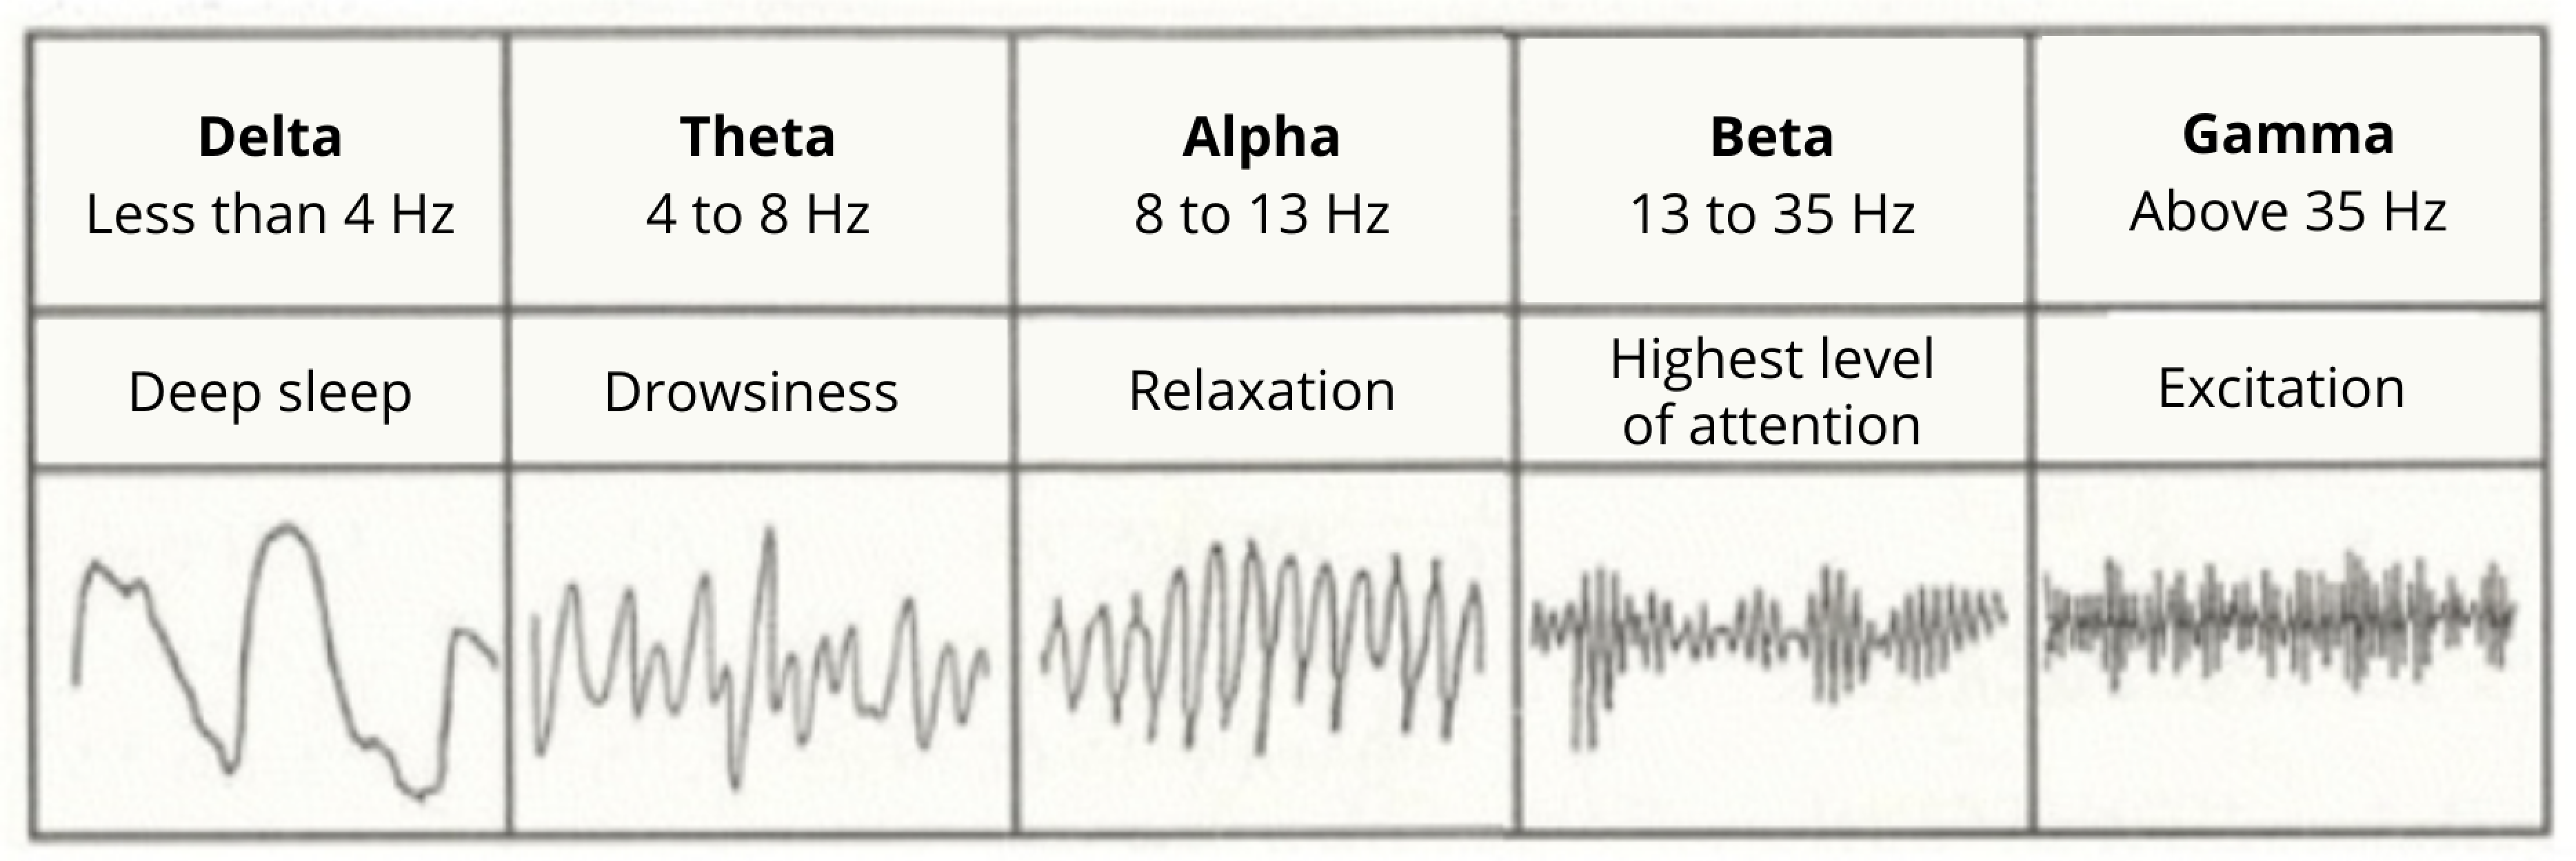
Brain rhythms are spontaneous signals that can be measured even in the absence of external stimulation. These rhythms are often used in cognitive neuroscience to classify sleep patterns and to identify patterns of atypical neuronal activity associated with pathologies (e.g., epilepsy, cervical tumours), states of consciousness and alertness. The frequency of the brain oscillations (i.e. the number of cycles per second) is measured in Hertz (Hz) (see Figure 3). Here are the main brain rhythms:

Delta rhythms: These are slow waves. They are present during a state of deep meditation or during sleep without dreams.

Theta rhythms: These are waves present during a deep sleep. These waves play a role in learning and consolidation in long-term memory.

Alpha rhythms: These waves are present during a state of alertness or light meditation. They are associated with the coordination of mental activities and learning. They are also associated with semantic processing, which allows us to access knowledge about the meaning of words (Klimesch, 1997;2012).

Beta rhythms: These waves are present during an awakening state when our attention is engaged by cognitive activities (e.g., making a decision, solve a problem) or by the environment. They would play an important role for the integration of audiovisual signals during speech perception (Romero et al., 2015).

Gamma rhythms: These are the fastest waves. They are associated with the processing of information by different regions of the brain (i.e., the synchronization of several regions of the brain). They are also present in states requiring a high level of attention or concentration. Research works also suggest that these oscillations may be associated with the acoustic treatment of speech sounds (Ou & Law, 2018).

Figure 3. Different brain oscillations (adapted from http://tpe-batement-binauraux.webnode.fr/quest-ce-que-les-battements-binauraux-/)

Evoked potentials

Unlike cerebral rhythms, evoked potentials represent the response of the central nervous system to an external stimulation (e.g., the appearance of a word on a computer screen) or an internal event (e.g., emotion, thought, memory). There are several types of evoked potentials, depending on the nature of the stimulation:

• Visual evoked potentials
• Auditory evoked potentials
• Somatosensory evoked potentials (e.g., related to sense of touch)
• Cognitive evoked potentials
• Motor evoked potentials

Since the electromagnetic noise captured by the electrodes is generally much higher than the EEG signal of interest, which is of very low amplitude, it is necessary to record several times the EEG signal associated with the same activity or repeated stimulation.  Averaging the signal over multiple trials will reveal the pattern of brain response. For example, in our laboratory, to measure the evoked potentials associated with speech perception, we would present a hundred words to participants, then calculate the average of the signal recorded during a few hundred milliseconds after the presentation of each word. This would reveal brain responses associated with word perception and distinguish it from those associated with background activity and noise.

The evoked potentials are identified according to their polarity (N = negative, P = positive), their time of appearance in milliseconds and their location on the scalp. For example, we can see on Figure 4 that the polarity of the evoked potential P1 is positive (the positive values are presented at the bottom of the graph) and that it occurs about 100 milliseconds after the presentation of a stimulus. P1 is associated with the processing of visual stimuli; the most reactive electrodes are located at the back of the head where the visual processing centers are located.

Figure 4. Diagram illustrating several evoked potentials (Components of ERP) from Choms, licensed under CC BY-SA 3.0.

The evoked potentials are useful both for clinical and research applications in the field of cognitive neuroscience. In a clinical setting, sensory evoked potentials (e.g., visual or auditory) can assist in the diagnosis of neurological diseases (e.g., multiple sclerosis, tumours of the auditory system). In research, evoked potentials are very important to study the time course of brain activity related to auditory, speech, language, memory for example (Luck, 2014).

Advantages and disadvantages of EEG

One of the advantages of EEG technique is its excellent temporal resolution (~1ms), which allows one to explore brain activity in real time, for example during the preparation or production of language, cognitive or motor tasks, or during sensory processing. Another advantage of EEG is that it is a “silent” technique compared to the MRI, which is interesting for researchers interested in hearing process, like us. EEG does not require lying in a narrow area without moving, making it a friendlier, less impressive methods than MRI. EEG acquisition and operating costs are much lower than that of MRI. In addition, EEG can be used with people of all ages, from newborns to the elderly as well as with clinical populations. There are no counterindication to EEG.

Disadvantages of EEG include its spatial resolution, which is much lower than for MRI, particularly because the electrical signals are attenuated by the structures they pass through (e.g., skull, scalp) that can distort them. This means that it is less straightforward to localise the source of EEG signals. Moreover, EEG, unlike MRI, does not provide a three-dimensional image of the brain.

However, EEG can be combined with MRI and TMS techniques using MRI and/or TMS compatible systems. This fall, our laboratory acquired a TMS compatible EEG system! Using this new system, we will explore the effects of TMS on the brain networks involved in speech, and how TMS can affect speech performance!

References

Collura, T. F. (1993). History and evolution of electroencephalographic instruments and techniques. J Clin Neurophysiol, 10(4), 476-504.

Klimesch, W. (2012). Alpha-band oscillations, attention, and controlled access to stored information. Trends in Cognitive Sciences, 16(12), 606–617.

Klimesch, W. (1997). EEG-alpha rhythms and memory processes. International Journal of Psychophysiology, 26(1-3), 319–340.

Luck, S. J. (2014). An introduction to the event-related potential technique: MIT press.

Ou, J., & Law, S.-P. (2018). Induced gamma oscillations index individual differences in speech sound perception and production. Neuropsychologia, 121, 28–36.

Romero, Y. R., Senkowski, D., & Keil, J. (2015). Early and late beta-band power reflect audiovisual perception in the McGurk illusion. Journal of Neurophysiology, 113(7), 2342–2350. 

Teplan, M. (2002). Fundamentals of EEG measurement. Measurement science review, 2(2), 1-11.

,