Do you want to read a scientific article, but you are not used to reading one, or maybe have never read one? Does the article seem long and full of technical terms? Do not panic! All of our lab members had to read their first scientific article at some point, and then several others in fields that were less familiar to them. So, here are some pro tips (and pro-to-be tips!) to help you understand any scientific article you’re interested in.
Reading an article in a field that is unfamiliar to us is like going on an expedition: like any good explorer, the first step is to prepare for your expedition!
First, prepare your materials. Here are some suggestions:
- A dictionary, ideally specialized in the field
- For the healthcare field, you can use the HeTOP Terminology Portal. Bonus feature: this portal can also serve as a translator!
- An encyclopedia or manual on the subject
- There are several online encyclopedias; the Canadian Encyclopedia and the Larousse encyclopedia are two interesting and free resources.
- The blog of the Speech and Hearing Neuroscience Laboratory — if you are interested in an article published by our lab or any other article related to language or cognitive neuroscience, you may find relevant explanations on our blog regarding certain concepts or neuroimaging methods (e.g., the difference between speech and language, MRI, TMS, etc.).
- Paper and pencil, computer, or smart phone to take notes as you read.
- A glass or bottle of water — staying hydrated is important!
Once you have gathered your materials, it’s time to start!
First step: Determine the reliability of the article.
Not all articles, and more generally, not all sources of information, are of the same quality. If you found the article on a credible page, such as a scientific search engine (e.g., Pubmed), an institutional repository (e.g., Corpus UL or HAL), the page of the Chief Scientist of Quebec, or the website of a university laboratory (like this one), it is likely that the article contains rigorous information.
It is important to distinguish between popular science articles and scientific articles themselves. Even though they may be more challenging, the ideal is to read the scientific articles and not the interpretation that other people have made of them. We can sometimes start with the popular article, and then continue with the scientific article.
Here are some ways to assess the reliability of a scientific article:
- Has the study been published in a rigorous and reliable source? Some journals are less rigorous than others. A serious scientific journal requires the evaluation of all articles by independent scientists (usually three) whose scientific or methodological expertise is related to the content of the articles. This is called peer review, and its purpose is to assess the relevance of the research questions, objectives and hypotheses, the quality of the methodology, the alignment between the research questions and the methodology, the rigor of the analyses, and the consistency of the interpretations.
- You can check a journal ranking, such as Scimago: Is the journal in question listed? That’s already evidence of a certain level of seriousness. What is the journal’s ranking?
- The higher the journal’s ranking quartile, the higher its impact factor. The impact factor reflects the journal’s influence and represents the number of citations received by articles published in it (divided by the number of articles published). The logic behind the calculation is that journals whose articles are cited more often have a greater impact. Of course, this method is not infallible, since certain articles are cited for criticism rather than praise.
- A journal in the first quartile is excellent in terms of impact and is generally a reliable source of information. That being said, one should not dismiss an article simply because it was published in a less prestigious journal. In addition to rigor, other factors play a role in the selection of articles published in major journals, such as the topic and the novelty of the results. Thus, a serious article that does not offer revolutionary results is less likely to appear in a major journal. The conclusion? Make sure your journal is peer-reviewed and listed in databases containing reputable journals (e.g., Pubmed, Web of Science, Scimago).
- You can check a journal ranking, such as Scimago: Is the journal in question listed? That’s already evidence of a certain level of seriousness. What is the journal’s ranking?
- Is the research team made up of scientists? Are the team members affiliated with universities or research centers? Does the team have expertise related to the study? Just as diver Alexandre Despatie would not be asked to play hockey for the Montreal Canadiens, scientists have specific areas of expertise, both scientifically (in terms of their research topic) and methodologically. The different members of the team each bring their own expertise, either methodological or scientific.
- You can search for the names of each team member on the website of the university or research center they are affiliated with. This information can be found in the article under the list of authors, in a section called affiliations. On the scientist’s professional webpage, you should find a description of their research interests, previous work, areas of study and links to other relevant sites, such as:
- The website of the researcher’s laboratory
- Here, you will find, among other things, the list of students who work in their lab. Some of them may be (co-)authors of articles, but not all may have a page in their name on the website of their university or research center.
- Their ORCID page.
- ORCID provides a unique identifier to each scientist. A researcher’s ORCID page usually lists their employment, education, qualifications, and works.
- Their SCOPUS profile.
- Here, you will find details of their scientific publications and their H-index — this measure resembles a journal’s impact factor. The higher the H-index, the more citations the researcher’s articles have. Although it is not infallible, a high H-index can be a good indicator of the researcher’s reputation. But beware! Students and early career scientists have low H-indices because they have published little, which is different from not having been cited. Additionally, H-indices are higher in some areas than others. An H-index must therefore be interpreted with nuance.
- Their profile at Research Gate.
- You can find several open-access articles here! But be careful: make sure they are reliable!
- You can search for the names of each team member on the website of the university or research center they are affiliated with. This information can be found in the article under the list of authors, in a section called affiliations. On the scientist’s professional webpage, you should find a description of their research interests, previous work, areas of study and links to other relevant sites, such as:
- Who funded the study? In Quebec and in Canada, a very large portion of research is funded by public funds from granting agencies that finance projects after evaluating their scientific quality. These organizations do not interfere in any way with how the projects are conducted. Among these organizations is, for example, the Fonds de recherche du Québec.
However, certain studies may be funded entirely or in part by private funds from non-profit or for-profit organizations, such as companies. For example, if a hearing aid company funded a study on the benefits of wearing hearing aids in older adults, a conflict of interest would arises. Oxford Academic Journals defines a conflict of interest as “any financial interests or connections, direct or indirect, or other situations that might raise the question of bias in the work reported or the conclusions, implications or opinions stated – including pertinent commercial or other sources of funding for the individual author(s) or for the associated department(s) or organization(s), personal relationships, or direct academic competition.” In our example about the hearing aid company, one would need to approach the article with a critical eye, as the conclusions of the article might have been influenced by their funding source to produce results that are favorable to the financial interests of the company. But this is not necessarily the case.
Of course, one must always exercise critical thinking when reading a scientific article, regardless of whether or not there are reported conflicts of interest!
Information about study funding is usually found at the end of an article, after the conclusion, in a section called “Declaration of conflicts of interest”. If there is an “acknowledgments” section, you can also check it for the presence of a conflict of interest.
For more details on the various scientific sources, we invite you to consult this additional blog post.
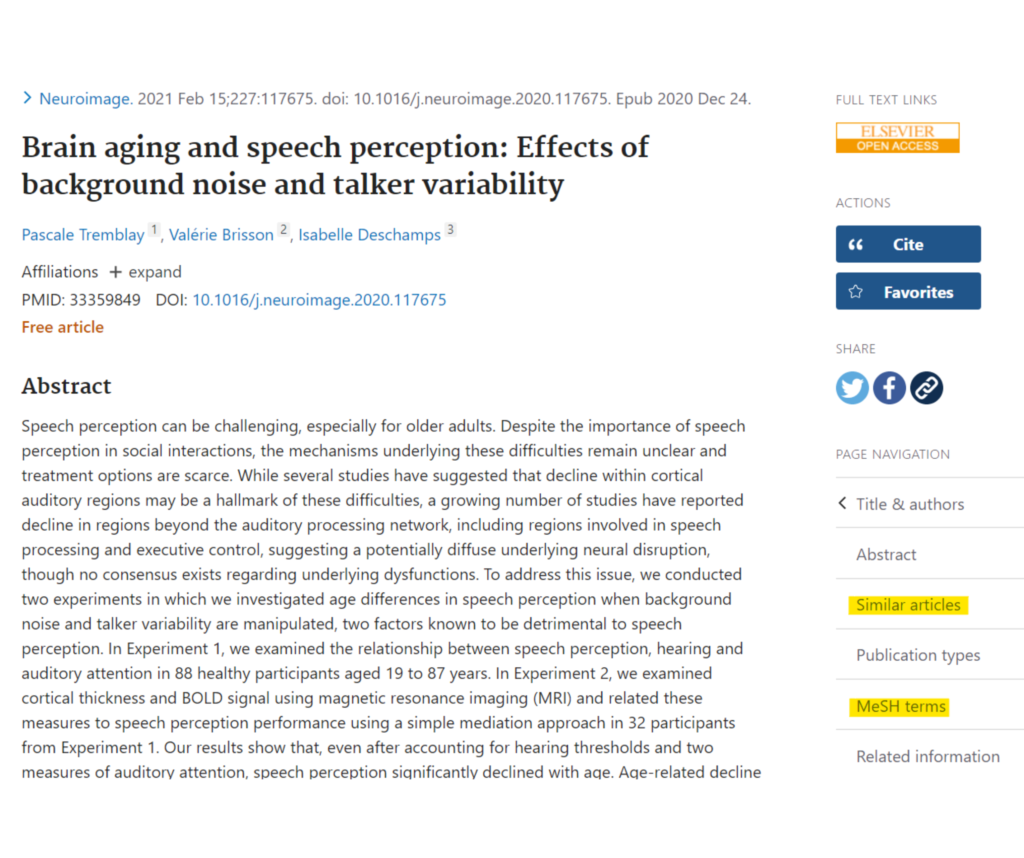
If, after your checks, the article does not seem very reliable, it is better to look for another one. In this case, one option would be to go to PubMed, a database of scientific articles. You can find your article there by searching its title — or better yet, the DOI (digital object identifier).
Here’s what you should see:

To the right of the abstract, under Page Navigation, two sections may be very useful to you: Similar articles and MeSH terms .
- Similar articles suggests articles that are similar to the one you are currently viewing. One of the suggested articles might be interesting!
- MeSH terms are controlled keywords. Articles on the same topic sometimes use different terms to refer to the same concept — for example, “hearing” and “auditory”. MeSH Terms help group all these terms under the same synonym, thus making the searches easier. You can use some of the MeSH Terms assigned to your initial article to find others on the same topic.
Once you have determined that your article is reliable, you are ready to start reading it!
The abstract
The first part to read is the abstract. Here, the article is summarized in one paragraph. This section is therefore often very dense and difficult to understand. Don’t worry! Everything mentioned here will be detailed later.
Use the abstract to get a sense of the situation: it provides you with an overview of the study’s objectives, the methods used by the research team, their hypothesis, highlights of the findings, and conclusions drawn by the research team.
Are there any words or concepts that you do not understand? Write them down. Many will be explained in the following sections of the article! However, if a concept is not explained the first time it appears in the body of the text, take a moment to look up its definition, as it may be important to grasp its meaning in order to fully understand the article.
Warning! Reading only the abstract will not give you a good idea about the article as a whole! Just like a movie trailer does not give you all the information and details that you would learn from watching the film, the abstract alone does not allow you to draw complete and accurate conclusions about the article. The abstract is indeed often very short and contains only a portion of the relevant information in article.
During your reading, it is very likely that you will see tables, graphs and images; these are called figures. Figures illustrate parts of the text, usually the results. You will be directed to them by references in parentheses. Check them out! They are there to help you understand the article. Bonus: figures break the monotony of a long text!
The introduction
Next, you can move on to the introduction. Here’s what you should find in this section:
- The context — why is this topic relevant?
- What is known about the subject — what are the results of previous studies?
- What has not yet been discovered or demonstrated — what gap does the team hope to fill?
- What the team has investigated — how has the team attempted to fill a knowledge gap?
- The hypothesis, if applicable – what results did the team expect?
Methodology
After looking up the concepts that were not defined in the introduction, it is now time to tackle the methodology.
If the concepts are described in the introduction, the tests or procedures are usually explained in the methodology. This section can be found after the introduction or at the end of the article.
This section should help you understand the work done by the team, and where their results come from. It can also be used by other scientists to replicate the study. Therefore, the methodology often contains a high level of detail. Since your goal is not to replicate the experiment, some details may be less useful to you than others. The sample size can inform you about the scope of a conclusion, while the brand name of a neuroimaging device or the name of an analysis software are likely to be less useful to you.
Here are some questions to consider:
- What is the general method of the study?
- If some techniques remain unclear, take a moment to research them. Understanding the methodology at least minimally will help you understand the results.
- Does the sample studied by the team allow them to answer the research question?
- For example, if the study is about the benefits of cognitive training in older people, the sample should include older people, not just young people.
- For the results to be applicable to all older people, the sample should, to the extent possible, include various types of older people: people with different levels of education, men and women of different ages (and not, for example, as is often the case, only people aged 60 to 75, who are easier to recruit), etc.
- The sample should also be large enough to be representative of the population under study. For example, if I ask 5 of my neighbors about the color of their eyes, and 4/5 (=80%) of them have blue eyes, I cannot conclude that the people in my neighborhood have an 80% chance of having blue eyes. This result is probably due to chance (and, if they were all from the same family, poor sampling), because my sample is too small.
The results
With the answers to these questions in mind, you can move on to the results.
This section is often filled with technical jargon and numbers; this level of detail is useful for other scientists but can be challenging for a casual reader. However, here are some basic ideas:
When statistical tests are conducted, research teams report whether the results are significant or not, often from a p-value ranging from 0 to 1. This p-value illustrates the probability that the result obtained is due to chance (and therefore does not represent a true result). The lower the p-value, the less likely the observed effect is due to chance. Often, a result is considered statistically significant when the p-value is less than 0.05. Let’s assume that we want to compare the performance on a speech perception test by two groups of older adults with and without cognitive impairment. Even if the average performance on the speech perception test for the group without cognitive impairment was numerically higher than that of the group with cognitive impairment (e.g., an average of 80% vs 75%), the research team would use a statistical test to determine the probability that this observed difference between the two averages is attributable to chance. If the p-value in question was less than 0.05, the team would conclude that the difference in performance for the groups with and without cognitive impairment appears significant.
However, it is important to note that the p-value is not the only element to pay attention to! In fact, the p-value does not indicate the strength of the observed effect. Thus, despite a p-value less than 0.05, the difference between the two groups, although real, could be small. Among the indicators of effect size, Cohen’s d is commonly used. The higher the d value, the stronger the effect. In general, d values of 0.2, 0.5 and 0.8 are considered to reflect weak, moderate and strong effects, respectively. When reading the results, if the d value is reported, you will have an indication of the strength of the observed effects.
The discussion
The discussion section of the article explains the results and what they mean in the context of the study and beyond. However, you should use critical thinking when reading this section. Do the results seem reasonably interpreted? It may be the case that the results of a study are overinterpreted or, in contrast, not sufficiently explained. Being aware of this will allow you to draw informed conclusions from the article.
The discussion also addresses the limitations of the study. What are the factors that require qualifying the conclusions? For example, a study with fewer participants has less predictive power than a study with a very large number of participants. Other factors that may influence the scope of the results are the following:
- Were the tests appropriate for the participants’ age? Do they reflect people’s abilities in their daily lives?
- Were the tests carried out under the best possible conditions? (For example, were they done in a quiet, distraction-free environment?)
- Does the discussion describe a process of data verification or interjudge agreement? This adds to the quality of the study.
The conclusion
Finally, the conclusion reiterates the key points of the article and suggests proposals for future studies that could complement or confirm what the present study has demonstrated. Note that the conclusion is sometimes integrated into the last lines of the discussion.
Congratulations, you have finished reading the article!
Did it answer your questions? Did it generate new ones? It is important to remember that a study never “proves” anything. It is the accumulation of evidence from the largest number of research teams that allows us to demonstrate that an observation is real and stable (on this subject, see our article on meta-analysis, a type of study which combines the results of several studies in the same analysis!). If your article follows a long series of similar demonstrations, your confidence level may be higher than if it is the first to demonstrate something. Time and subsequent studies will validate or qualify this result .
Happy reading!


