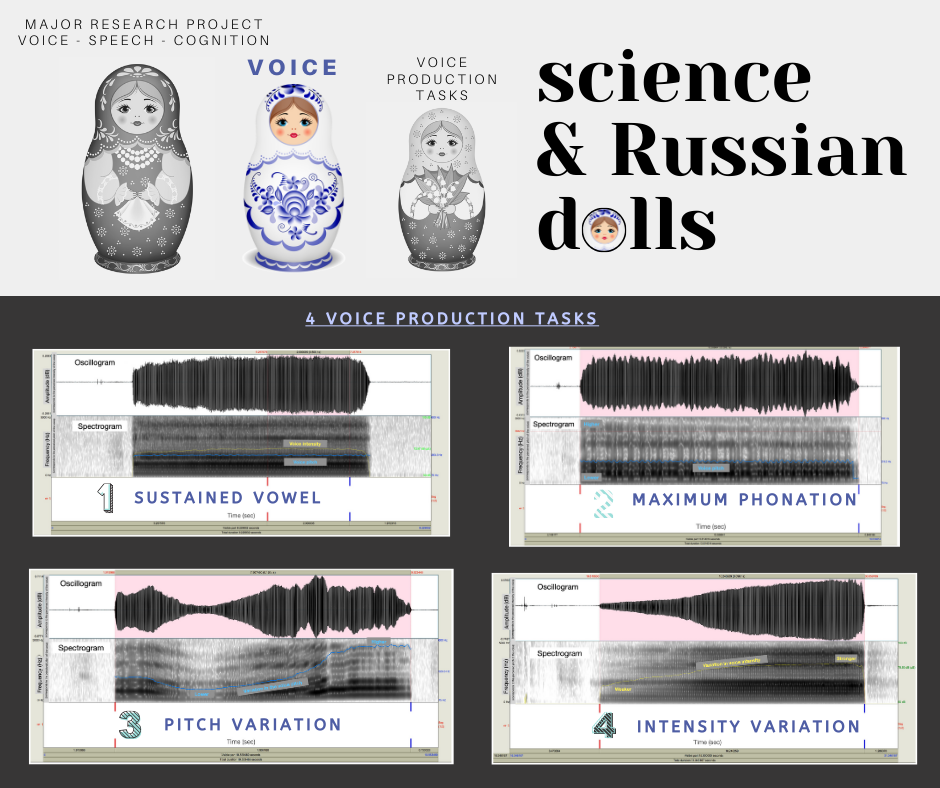
The data from our project on singing (project 192-2017) are currently under analysis. This project, which aimed to identify the positive effects of choral singing on communication in aging, involved 142 participants, both singers and non-singers. Thanks again to everyone who participated! Today, we bring you an overview of the data related to the study of voice, one of the components of communication that we have measured. Each image presented here illustrates one of the four tasks that the participants completed.
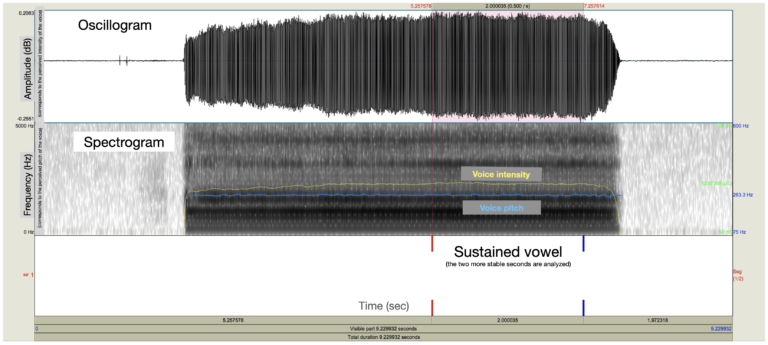
Task: Sustained vowel. The participant had to continuously hold the vowel “a” for 5 seconds. This is a classic task for measuring the voice properties such as pitch, intensity, stability, and the amount of noise it contains. The blue line on the spectrogram represents the average height while the yellow line represents the average intensity at each moment, i.e., its loudness measured in decibels (dB).
The top graph is an oscillogram. It represents the vibrations of the participant’s voice. The louder the sound, the greater the amplitude (height) of the vertical lines (waves). A higher-pitched sound has a greater frequency, that is, the sound waves are closer together. In contrast, a lower-pitched sound is created by slower waves and thus has a lower frequency.
The spectrogram, at the bottom, allows a more detailed representation of the sound’s characteristics. High-pitched sounds are shown at the top of the graph, while low-pitched sounds are located at the bottom of the graph. In this graph, the louder a sound is, the darker it is. The blue line represents the average pitch of the sound over time.
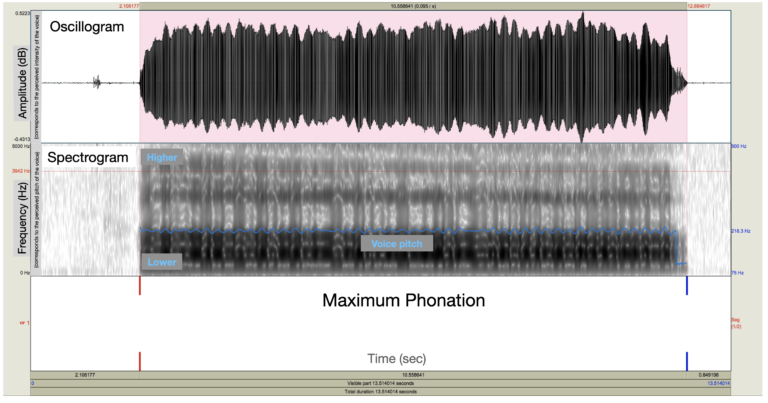
Task: Maximum phonation. The participant had to hold the vowel “a” for as long as possible. This task allows us to measure a person’s phonatory abilities, that is, their ability to vocalize. The blue line on the spectrogram represents the variation in a participant’s pitch. Here, their voice is stable and rather deep (the blue line is at the bottom of the graph, where the low frequencies are located).
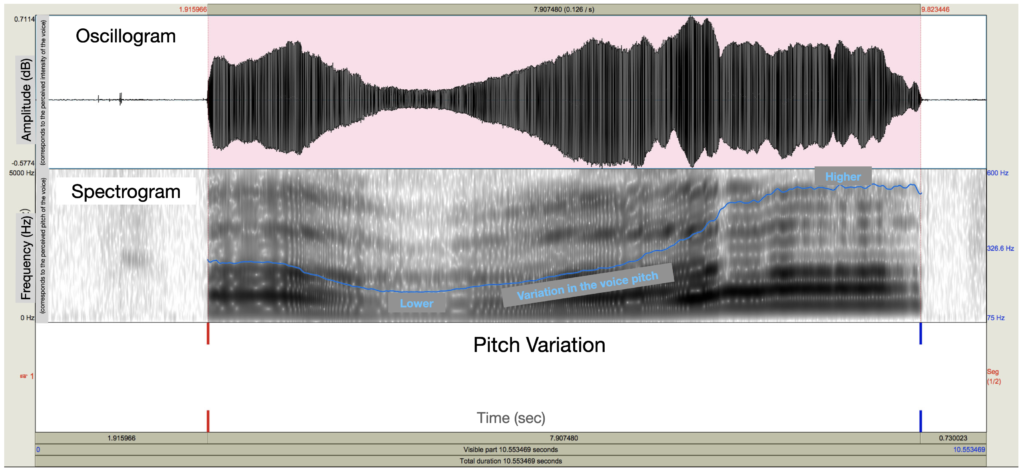
Task: Pitch variation. The participant had to sustain the vowel “a” continuously and normally at first, then lower and lower, and then higher and higher. This task allows us to measure a person’s ability to control the pitch of their voice.
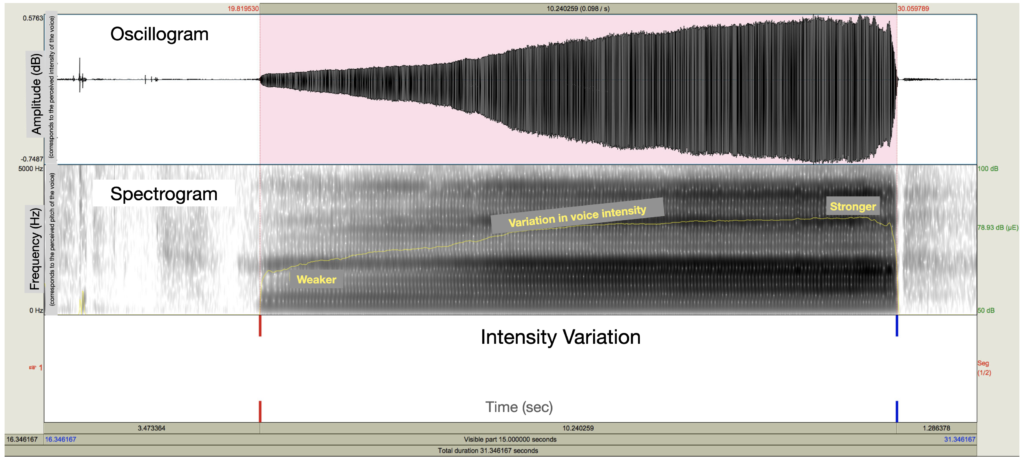
Task: Intensity variation. The participant had to sustain the vowel “a” from the lowest intensity possible to the highest intensity possible. This task allows us to measure a person’s ability to control the intensity of their voice. On the spectrogram, at the bottom, the curve (yellow line) illustrates the variation in the voice’s intensity. The participant began with a whisper and finished the task at maximum loudness.
